


From December 20 – Jan 2, Amadeus sees a consistent trend in hotel bookings for the holiday season
While the Christmas holiday traditionally has lower occupancy levels than Thanksgiving, Amadeus, a global leader in travel technology, with its unique ability to track actual forward-looking hotel bookings in major markets around the world, continues its reporting of consumer travel trends for hotels during major U.S. holidays. As of December 14, 2020, U.S. hotel occupancy for the week of Christmas is at 15%. While this is slightly down from the weeks leading up to the Thanksgiving holiday, it aligns with historical trends of lower bookings for Christmas compared to Thanksgiving. Booking window trends remain steady with 68% of accommodations booked in the 0-7 day range, including 40% of bookings made on the day of check-in.
Key insights for Christmas and New Year’s holiday weeks:
Top destinations for Christmas and New Year’s (December 20-Jan 02) with over 50% hotel occupancy are (see Figure 1):
1) Vail, Colorado
2) Key West, Florida
3) Sedona, Arizona
4) Aspen, Colorado
5) Fort Meyers, Florida
For the upcoming holidays, travelers are keen on snow or sand with cool weather destinations such as ski towns or warmer destinations for time in the sun. The top five destinations have many opportunities for outdoor activities, depending on traveler preferences.
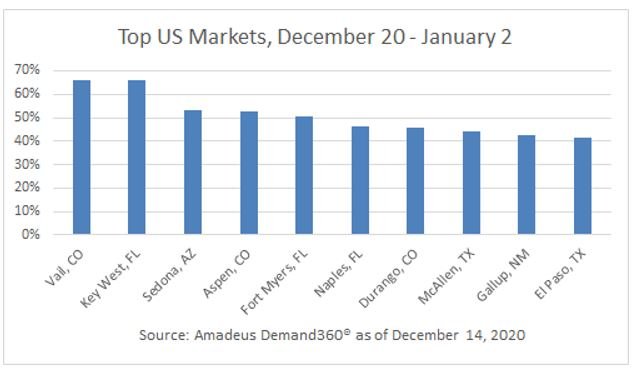
Figure 1: Top US markets by occupancy for the week of Christmas.
Weekly occupancy pace (see Figure 2):
Adding Christmas to the occupancy buildup for 2020 holidays, there is a gradual increase in occupancy across the three weeks leading up to each holiday. For Thanksgiving, the same increase occurred in the three weeks leading up to the holiday, but the actual holiday week saw less of a rise in occupancy than Labor Day and July 4th, likely driven by rising COVID-19 case counts and local government suggestions to limit travel.
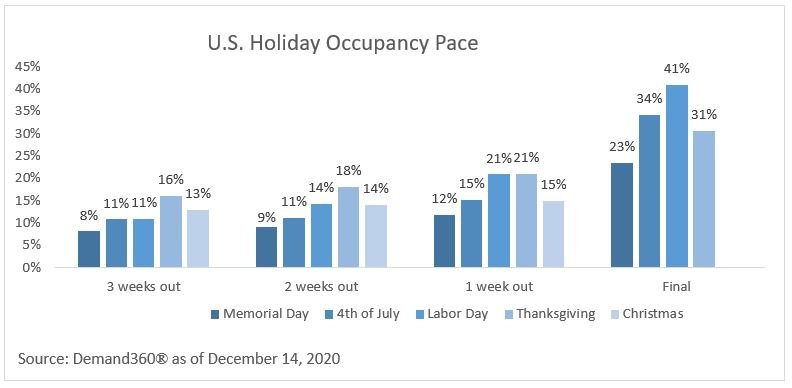
Figure 2: Booked hotel occupancy according to booking window.
For the Christmas holiday, the lower occupancy percentages compared to the Thanksgiving holiday are a near exact match to the relative occupancy build up in the prior year. In 2019, Christmas occupancy three weeks prior to the holiday was 2% lower than Thanksgiving, two weeks prior was 4% lower and one week prior was 5% lower. In 2020 we find the same percentage difference except for one week prior being 6% lower in 2020. This provides a measure of optimism that while overall occupancy may have declined, it is still on pace with historical holiday to holiday performance.
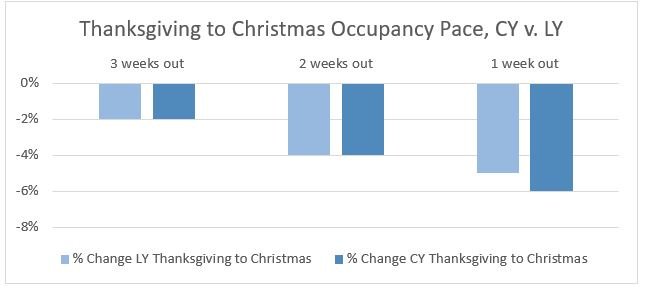
Figure 3: Occupancy pace from Thanksgiving to Christmas, 2019 (LY) vs 2020 (CY)
According to Katie Moro, Vice President, Data Partnerships, Hospitality, Amadeus, “The consistent year-over-year booking trends from Thanksgiving to Christmas demonstrate that the improved market performance we experienced through the summer and fall seasons is continuing into the winter holidays. As we look ahead to the coming months, we hear optimism for the return of travel with vaccine announcements. Many individuals are eager to resume travel after months of pent-up demand. Hoteliers should watch for leading indicators in their local and source markets to identify when they should begin taking action on their recovery plans.”
Observation about top source markets
Where are these travelers coming from? Travelers who have booked trips with a hotel stay for the Christmas and New Year’s holidays are travelling from the areas below. While ranking may have changed, many of these markets were also at the top of the list for Thanksgiving. There are two market changes: Tampa – St. Petersburg, FL, has replaced San Francisco – Oakland, CA, and Orlando – Kissimmee, FL, has replaced Philadelphia – Camden – Wilmington, PA.
1) New York – Northern New Jersey – Long Island, NY-NJ-PA, US
2) Atlanta – Sandy Springs – Marietta, GA, US
3) Dallas – Fort Worth – Arlington, TX, US
4) Los Angeles – Long Beach – Santa Ana, CA, US
5) Chicago – Naperville – Joilet, IL-IN-WI, US
6) Houston – Sugar Land – Baytown, TX, US
7) Washington – Arlington – Alexandria, DC-VA-MD-WV, US
8) Miami – Fort Lauderdale – Pompano Beach, FL, US
9) Tampa – St. Petersburg – Clearwater, FL, US
10) Orlando – Kissimmee, FL, US
Your trusted source for industry-leading forward-looking market insight
Amadeus Demand360® is the only business intelligence solution that provides actual forward-looking occupancies for your hotel and your selected competitive sets. The data provided is updated twice per week and occupancy information represents actual rooms sold, including market segment and channel statistics, so you know who is traveling and how they are booking their reservations. If you want to know what is happening in your market contact us today.
For more best practices on leveraging data to build an effective marketing strategy, please visit our Planning for Hospitality Recovery resource center.